scroll for more
Sol — G2V
Teff: 5778 K
Activity: 50%
Rotation: 25.4 days (eq.)
X-ray: —
F10.7: — sfu
Wind: — km/s
FPS: --
Drag · Pinch · Scroll
SDO/AIA Live Imagery & SOHO · Updated every ~12 min
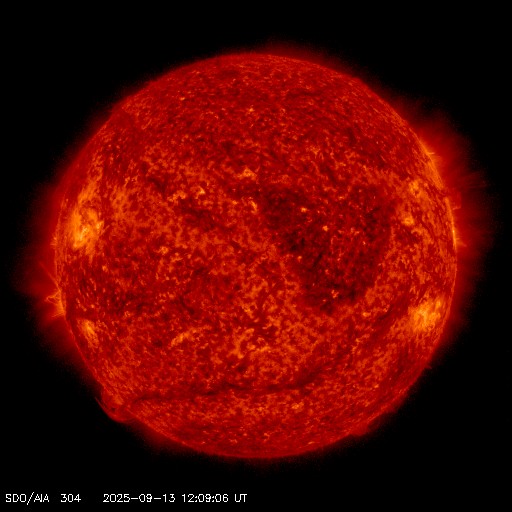 AIA 304 Å
Chromosphere
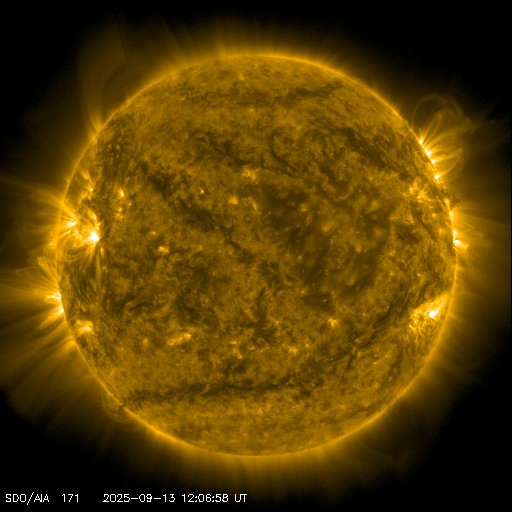 AIA 171 Å
Coronal loops
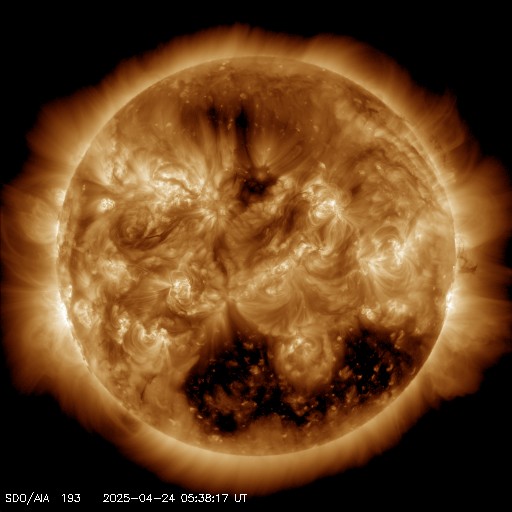 AIA 193 Å
Active corona
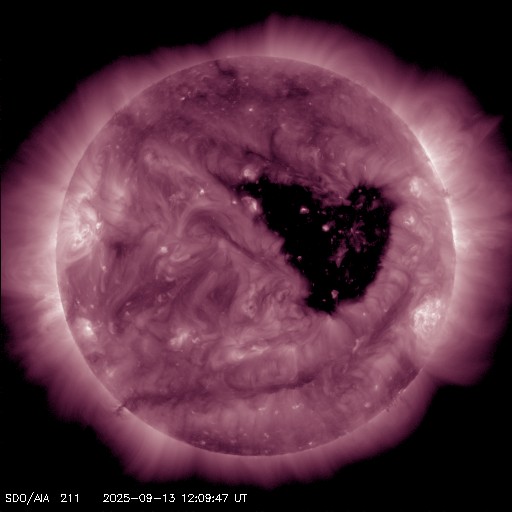 AIA 211 Å
Active regions
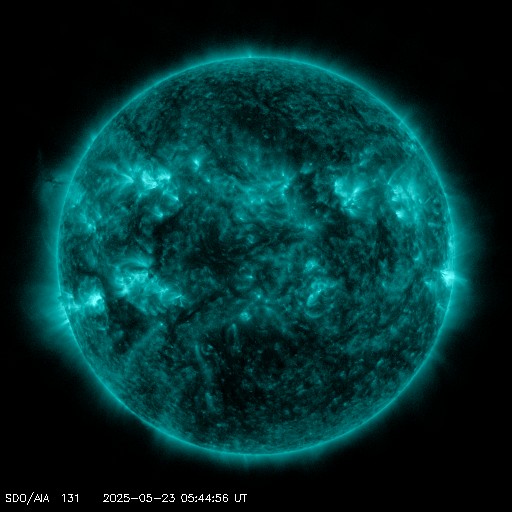 AIA 131 Å
Flare plasma
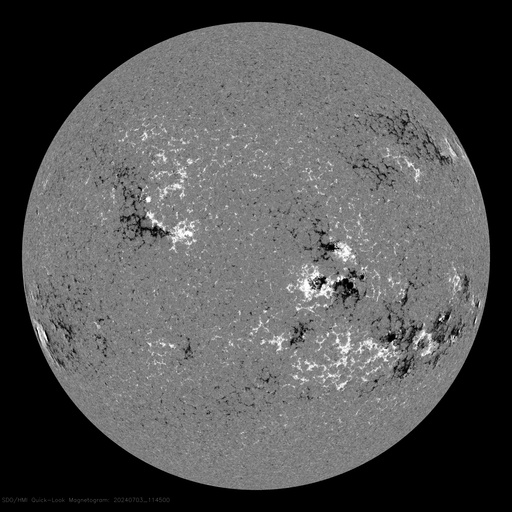 HMI Mag
B-field LOS
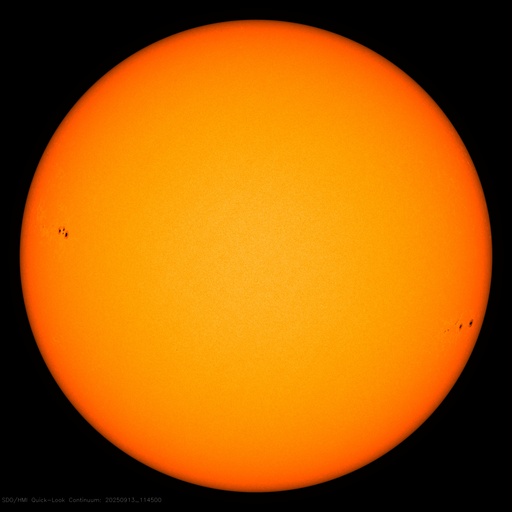 HMI IC
Photosphere
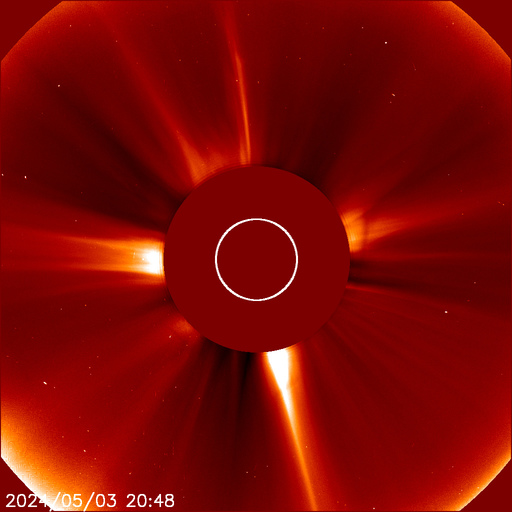 LASCO C2
2–6 R☉
A
X-Ray
—
Solar Wind
— km/s
Density
— /cc
IMF Bz
— nT
Kp
—
R-scale
R0
S-scale
S0
F10.7
— sfu
🌍
G0
Quiet at Earth
NOAA · connecting…